Quick answer: The better Pinterest Pin is not automatically the one with more impressions. First decide what the Pin was meant to do. Then compare Pins over the same observation window using the rate that matches that goal: save rate for saving activity, calculated closeup-click ratio for closeup activity, outbound click rate for website traffic, and engagement rate for overall response.
Counts tell you what happened at the current level of distribution. Rates tell you how efficiently each Pin used the attention it received. A useful comparison needs both.
A Pin Cannot Win Without a Goal
Pinterest Analytics opens with many numbers, but those numbers do not answer the same question.
A Pin created to introduce a broad idea may be successful because it earns distribution. A Pin created to send people to a product page should be judged by outbound traffic. A tutorial people want to revisit may earn saves without producing the most immediate clicks.
That gives us the first rule of Pin comparison:
Choose the job before choosing the winner.

Use this goal-to-metric map:
| If the goal is… | Start with… | What it answers |
|---|---|---|
| Awareness | Impressions | Which Pin appeared on screen more often? |
| Future intent | Save rate | Which Pin felt worth keeping? |
| Closeup activity | Calculated closeup-click ratio | Which Pin had more closeup opens per impression? |
| Website traffic | Outbound click rate | Which Pin sent attention off Pinterest? |
| Overall response | Engagement rate | Which Pin produced more interactions per impression? |
If your real goal is a sale, lead, or signup, Pinterest engagement is only part of the story. The final winner should also be checked against your website analytics or Pinterest Conversion Insights when available.
Compare the Same Kind of Opportunity
Before calculating anything, make the comparison fair.
- Use the same observation window. Compare each Pin's first 7 days, first 14 days, or another consistent period—not one Pin's lifetime total against another Pin published yesterday.
- Separate organic and paid distribution. Paid reach changes the opportunity each Pin received.
- Compare the same goal. A save-led educational Pin and a traffic-led product Pin can both succeed at different jobs.
- Check format, source, and device. Pinterest Analytics lets you filter or split performance by content type, device, and source. A video Pin and a static Pin may invite different behavior.
- Check the destination. A broken, slow, or mismatched landing page can suppress outbound results even when the creative earns attention.
- Avoid tiny verdicts. A Pin with two outbound clicks from 100 impressions has a 2% rate, but the result is too small to treat as a stable creative truth.
Pinterest says there is no fixed engagement window for Pins: a Pin may gain engagement hours, days, months, or years after publication. That is why an equal-age comparison is more useful than pretending every Pin is “finished” after an arbitrary number of days.
The Five Pinterest Metrics That Matter
Pinterest defines the metrics separately. The questions and graphics below are planning prompts, not evidence of a person-level funnel or the reasons people acted.
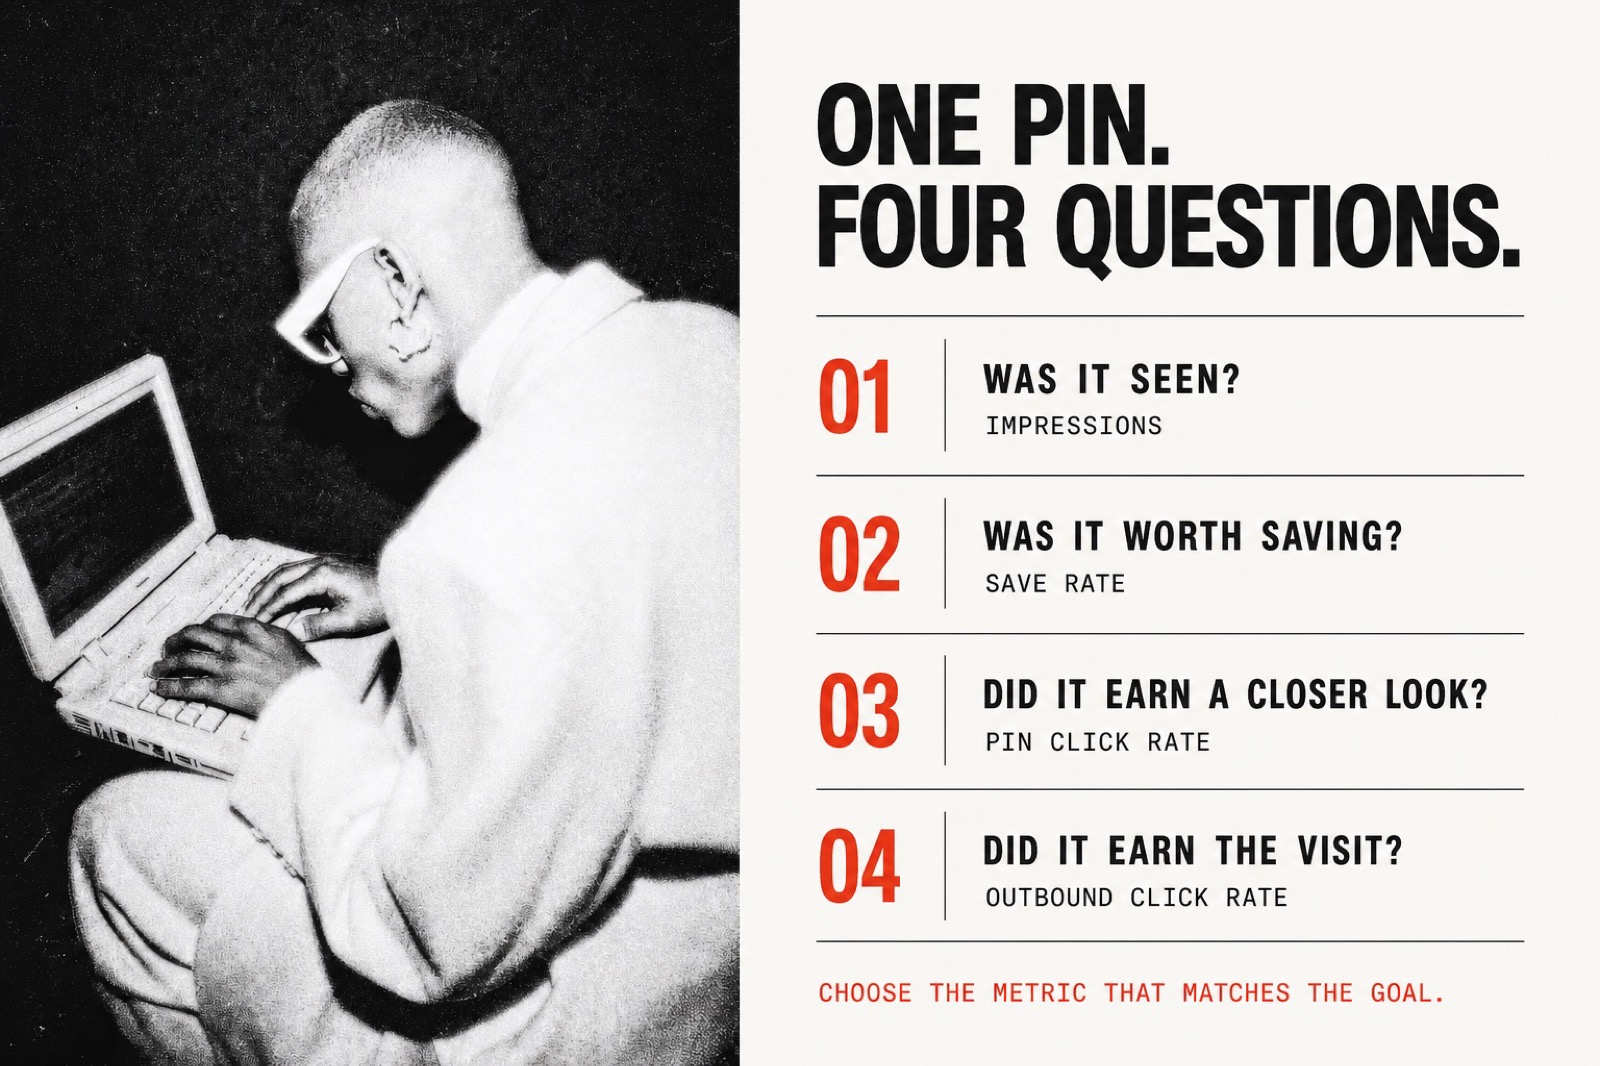
1. Impressions: Did Pinterest Show It?
Pinterest defines impressions as the number of times your Pins or ads were on screen. Impressions measure exposure, not unique people, approval, or business results.
Use the raw count when your goal is reach. When two Pins have very different impression totals, use rates for the next layer of comparison so the Pin with greater distribution does not win every category by default.
For a deeper explanation, read What Are Impressions on Pinterest?.
2. Save Rate: Was It Worth Keeping?
Pinterest defines saves as the number of times people saved your Pin to a board. Save rate normalizes those saves by exposure.
Save rate = saves ÷ impressions × 100
Saves often signal future intent: the idea may be useful later even if the person is not ready to leave Pinterest now. Recipes, checklists, seasonal plans, reference graphics, and tutorials naturally give people a reason to save.
3. Calculated Closeup-Click Ratio: Did It Earn a Closer Look?
Pinterest Analytics defines the Pin clicks count as opens into closeup. Its Pin click rate definition uses broader on-or-off-Pinterest wording, as does the separate Pin stats page. Keep the reporting surface and metric definition clear.
Calculated closeup-click ratio = closeup Pin clicks ÷ impressions × 100. This is the calculation used in our example and graphics. It is not a substitute for Pinterest’s reported Pin click rate.
High Pin-click activity with lower outbound activity can suggest a test of the Pin’s promise and destination. The counts do not establish that the same people stopped at a particular step. See what a Pin click means.
4. Outbound Click Rate: Did It Earn the Visit?
Pinterest defines outbound clicks as actions that lead to a destination off Pinterest. For traffic-led Pins, this is usually the cleanest platform metric.
Outbound click rate = outbound clicks ÷ impressions × 100
Pinterest notes that outbound clicks are measured from the date a link is added. If you add or change the link later, do not assume the visible number covers the Pin's entire history.
5. Engagement Rate: Did Attention Turn Into Action?
Pinterest defines engagement rate as total engagements divided by the total number of times Pins were seen. Engagements can include saves, Pin clicks, outbound clicks, carousel swipes, and secondary creative clicks.
Engagement rate = total engagements ÷ impressions × 100
Use Pinterest's reported engagement rate when possible. A manual formula that adds only saves, Pin clicks, and outbound clicks is a useful core-action rate, but it may not exactly match Pinterest for formats with additional engagement types.
Worked Example: Which Pin Actually Won?
Imagine two organic Pins linking to the same article. The numbers below are a constructed example, not a Pinterest benchmark.
So which Pin won?
- Pin A won impressions and outbound clicks. It recorded five times the impressions and 24 more outbound clicks. Website analytics would be needed to confirm loaded visits.
- Pin B won the calculated action ratios. Its recorded counts per impression were higher in this example.
- Use the result to choose a test. Compare a new variation under similar conditions rather than assuming the example explains why people acted.
The example separates total recorded activity from activity per impression. It does not prove persuasion or a sequence of actions by the same people.
How to Read Common Metric Combinations
High impressions, low response rates
The Pin has exposure but relatively few recorded actions. Test a clearer promise, focal point or closer topic match. The counts do not establish that creative quality caused the gap.
Do not abandon a topic from one comparison. Check audience, format, age and reporting conditions as well as the creative. Our impressions guide discusses discovery tests.
Low impressions, high response rates
This pattern can suggest further testing, but small counts may be unstable. Recheck the same window and filters before drawing a conclusion.
High calculated closeup-click ratio, low outbound click rate
Check whether the closeup and destination match the promise and whether the link works. Treat this as a hypothesis to test, not proof that individual viewers abandoned a funnel.
High save rate, low outbound click rate
The content may be more useful “for later” than urgent now. That can be the correct result for inspiration, planning, and reference content. If immediate traffic matters, test a more time-sensitive benefit or a clearer reason to visit today.
High outbound click rate, modest impressions
This is a promising traffic Pin with limited exposure. Create a fresh variation around the same offer rather than repeatedly uploading the identical image. Preserve the message that earns the click while testing a new composition, headline, or search angle.
Where to Find the Numbers in Pinterest
You need a Pinterest business account to access Analytics.
- Open Analytics → Overview.
- Set the date range and filters you want to compare.
- Review Top Pins.
- Change the sorting metric from impressions to engagements, Pin clicks, outbound clicks, or saves.
- Open an individual Pin and select See more stats for its detailed performance.
Pinterest says real-time metrics are estimates and may change. Pin stats can also look different from Analytics, and Pinterest may aggregate activity for Pins sharing an image and, when applicable, a URL—including downstream saves. Record the source and date range alongside your comparison instead of treating one screenshot as permanent truth.
A Clean Pin Comparison Checklist
Before naming a winner, ask:
- Same goal? — Are both Pins trying to create the same outcome?
- Same age? — Are you comparing equal post-publication windows?
- Same distribution type? — Organic against organic, or paid against paid?
- Enough exposure? — Is the result larger than a handful of actions?
- Right metric? — Does the winning metric match the business goal?
- Counts and rates? — Which Pin produced more total value, and which used exposure more efficiently?
- Same destination quality? — Were both links accurate, relevant, and working?
- One next test? — What single variable will you carry into the next variation?
The point of comparison is not to award a trophy. It is to make the next Pin more intentional.
Frequently Asked Questions
How do you compare the performance of two Pinterest Pins?
Choose the goal, use comparable observation windows, separate organic and paid activity, and compare counts with the relevant reported rates. Keep metric definitions and reporting surfaces consistent; aggregate counts do not establish an individual user journey.
What is a good Pinterest engagement rate?
Pinterest does not publish one universal “good” organic engagement rate for every niche, format, account, and goal. Compare against your own recent Pins under similar conditions and look for repeatable improvement instead of relying on a generic benchmark.
Which Pinterest metric matters most?
Choose the metric that matches the goal: impressions for exposure, saves for saving activity, the relevant Pin-click metric for click activity, outbound clicks for actions leading off Pinterest, and destination outcomes for sales or leads.
Should I compare Pinterest Pin counts or rates?
Use both. Counts show total value produced at the current distribution level. Rates show how efficiently each Pin converted its impressions into action.
How long should I wait before comparing Pinterest Pins?
Pinterest publishes no fixed engagement window. Use an equal-age window that gives both Pins a fair opportunity, record it, and repeat the comparison later because Pins can continue gaining engagement over time.
Sources
- Review Pinterest Analytics — Pinterest Business Help definitions for impressions, engagements, rates, Top Pins, and real-time estimates
- Review your Pin stats — Pinterest Business Help instructions, core Pin metrics, filters, and aggregation notes
- Pin performance and distribution — Pinterest Business Help guidance on distribution, engagement timing, fresh content, links, and performance review